Variants in Arizona Genomes by Month
 Lineages are assigned by Pangolin (O'Toole et al Virus Evolution)
Displayed is a stacked bar graph, which shows proportions of SARS-CoV-2 variants circulating in Arizona. Viral genomes submitted to GISAID that were sequenced from COVID-19 positive patients in Arizona are represented in this figure. Lineages are assigned by Pangolin (O'Toole et al Virus Evolution). Given the expanding knowledge of emerging variants and improvements to analysis tools, lineages determined by Pangolin are subject to change.
The variants described above are reflective of the CDC’s SARS-CoV-2 Variant Classifications and Definitions.
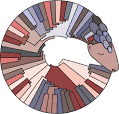
Phylogenetic Timetree of Arizona Genomes
Displayed is a phylogenetic tree, which is a reconstruction of the relationships between viral genomes similar to a family tree. Here we selected a subset of genomes from GISAID that were sequenced from COVID-19 positive patients in Arizona. Each dot on the tree represents one of these viral genomes, colored by variant (matches the stacked bar graph on the left). Viral genomes that have more mutations in common will be placed closer together by their connecting branches. The horizontal axis represents the time of collection for the samples that were sequenced. Not all positive COVID-19 cases are sequenced. For more information on this figure and how we built it, visit the Nextstrain website https://nextstrain.org/.